Processor problems have been in the news lately, due to the Meltdown and Spectre vulnerabilities. But generally, engineers writing software assume that computer hardware operates in a reliable, well-understood fashion, and that any problems lie on the software side of the software-hardware divide. Modern processor chips routinely execute many billions of instructions in a second, so any erratic behaviour must be very hard to trigger, or it would quickly become obvious.
But sometimes that assumption of reliable processor hardware doesn’t hold. Last year at Cloudflare, we were affected by a bug in one of Intel’s processor models. Here’s the story of how we found we had a mysterious problem, and how we tracked down the cause.

CC-BY-SA-3.0 image by Alterego
Prologue
Back in February 2017, Cloudflare disclosed a security problem which became known as Cloudbleed. The bug behind that incident lay in some code that ran on our servers to parse HTML. In certain cases involving invalid HTML, the parser would read data from a region of memory beyond the end of the buffer being parsed. The adjacent memory might contain other customers’ data, which would then be returned in the HTTP response, and the result was Cloudbleed.
But that wasn’t the only consequence of the bug. Sometimes it could lead to an invalid memory read, causing the NGINX process to crash, and we had metrics showing these crashes in the weeks leading up to the discovery of Cloudbleed. So one of the measures we took to prevent such a problem happening again was to require that every crash be investigated in detail.
We acted very swiftly to address Cloudbleed, and so ended the crashes due to that bug, but that did not stop all crashes. We set to work investigating these other crashes.
Crash is not a technical term
But what exactly does “crash” mean in this context? When a processor detects an attempt to access invalid memory (more precisely, an address without a valid page in the page tables), it signals a page fault to the operating system’s kernel. In the case of Linux, these page faults result in the delivery of a SIGSEGV signal to the relevant process (the name SIGSEGV derives from the historical Unix term “segmentation violation”, also known as a segmentation fault or segfault). The default behaviour for SIGSEGV is to terminate the process. It’s this abrupt termination that was one symptom of the Cloudbleed bug.
This possibility of invalid memory access and the resulting termination is mostly relevant to processes written in C or C++. Higher-level compiled languages, such as Go and JVM-based languages, use type systems which prevent the kind of low-level programming errors that can lead to accesses of invalid memory. Furthermore, such languages have sophisticated runtimes that take advantage of page faults for implementation tricks that make them more efficient (a process can install a signal handler for SIGSEGV so that it does not get terminated, and instead can recover from the situation). And for interpreted languages such as Python, the interpreter checks that conditions leading to invalid memory accesses cannot occur. So unhandled SIGSEGV signals tend to be restricted to programming in C and C++.
SIGSEGV is not the only signal that indicates an error in a process and causes termination. We also saw process terminations due to SIGABRT and SIGILL, suggesting other kinds of bugs in our code.
If the only information we had about these terminated NGINX processes was the signal involved, investigating the causes would have been difficult. But there is another feature of Linux (and other Unix-derived operating systems) that provided a path forward: core dumps. A core dump is a file written by the operating system when a process is terminated abruptly. It records the full state of the process at the time it was terminated, allowing post-mortem debugging. The state recorded includes:
- The processor register values for all threads in the process (the values of some program variables will be held in registers)
- The contents of the process’ conventional memory regions (giving the values of other program variables and heap data)
- Descriptions of regions of memory that are read-only mappings of files, such as executables and shared libraries
- Information associated with the signal that caused termination, such as the address of an attempted memory access that led to a SIGSEGV
Because core dumps record all this state, their size depends upon the program involved, but they can be fairly large. Our NGINX core dumps are often several gigabytes.
Once a core dump has been recorded, it can be inspected using a debugging tool such as gdb. This allows the state from the core dump to be explored in terms of the original program source code, so that you can inquire about the program stack and contents of variables and the heap in a reasonably convenient manner.
A brief aside: Why are core dumps called core dumps? It’s a historical term that originated in the 1960s when the principal form of random access memory was magnetic core memory. At the time, the word core was used as a shorthand for memory, so “core dump” means a dump of the contents of memory.
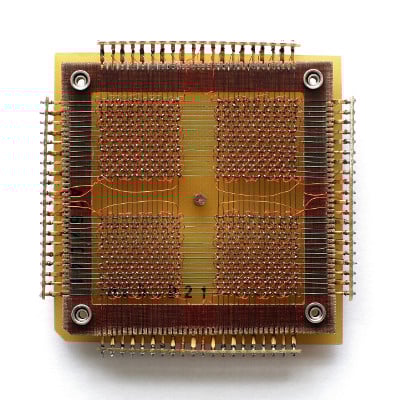
CC BY-SA 3.0 image by Konstantin Lanzet
The game is afoot
As we examined the core dumps, we were able to track some of them back to more bugs in our code. None of them leaked data as Cloudbleed had, or had other security implications for our customers. Some might have allowed an attacker to try to impact our service, but the core dumps suggested that the bugs were being triggered under innocuous conditions rather than attacks. We didn’t have to fix many such bugs before the number of core dumps being produced had dropped significantly.
But there were still some core dumps being produced on our servers — about one a day across our whole fleet of servers. And finding the root cause of these remaining ones proved more difficult.
We gradually began to suspect that these residual core dumps were not due to bugs in our code. These suspicions arose because we found cases where the state recorded in the core dump did not seem to be possible based on the program code (and in examining these cases, we didn’t rely on the C code, but looked at the machine code produced by the compiler, in case we were dealing with compiler bugs). At first, as we discussed these core dumps among the engineers at Cloudflare, there was some healthy scepticism about the idea that the cause might lie outside of our code, and there was at least one joke about cosmic rays. But as we amassed more and more examples, it became clear that something unusual was going on. Finding yet another “mystery core dump”, as we had taken to calling them, became routine, although the details of these core dumps were diverse, and the code triggering them was spread throughout our code base. The common feature was their apparent impossibility.
There was no obvious pattern to the servers which produced these mystery core dumps. We were getting about one a day on average across our fleet of servers. So the sample size was not very big, but they seemed to be evenly spread across all our servers and datacenters, and no one server was struck twice. The probability that an individual server would get a mystery core dump seemed to be very low (about one per ten years of server uptime, assuming they were indeed equally likely for all our servers). But because of our large number of servers, we got a steady trickle.
In quest of a solution
The rate of mystery core dumps was low enough that it didn’t appreciably impact the service to our customers. But we were still committed to examining every core dump that occurred. Although we got better at recognizing these mystery core dumps, investigating and classifying them was a drain on engineering resources. We wanted to find the root cause and fix it. So we started to consider causes that seemed somewhat plausible:
We looked at hardware problems. Memory errors in particular are a real possibility. But our servers use ECC (Error-Correcting Code) memory which can detect, and in most cases correct, any memory errors that do occur. Furthermore, any memory errors should be recorded in the IPMI logs of the servers. We do see some memory errors on our server fleet, but they were not correlated with the core dumps.
If not memory errors, then could there be a problem with the processor hardware? We mostly use Intel Xeon processors, of various models. These have a good reputation for reliability, and while the rate of core dumps was low, it seemed like it might be too high to be attributed to processor errors. We searched for reports of similar issues, and asked on the grapevine, but didn’t hear about anything that seemed to match our issue.
While we were investigating, an issue with Intel Skylake processors came to light. But at that time we did not have Skylake-based servers in production, and furthermore that issue related to particular code patterns that were not a common feature of our mystery core dumps.
Maybe the core dumps were being incorrectly recorded by the Linux kernel, so that a mundane crash due to a bug in our code ended up looking mysterious? But we didn’t see any patterns in the core dumps that pointed to something like this. Also, upon an unhandled SIGSEGV, the kernel generates a log line with a small amount of information about the cause, like this:
segfault at ffffffff810c644a ip 00005600af22884a sp 00007ffd771b9550 error 15 in nginx-fl[5600aeed2000+e09000]
We checked these log lines against the core dumps, and they were always consistent.
The kernel has a role in controlling the processor’s Memory Management Unit to provide virtual memory to application programs. So kernel bugs in that area can lead to surprising results (and we have encountered such a bug at Cloudflare in a different context). But we examined the kernel code, and searched for reports of relevant bugs against Linux, without finding anything.
For several weeks, our efforts to find the cause were not fruitful. Due to the very low frequency of the mystery core dumps when considered on a per-server basis, we couldn’t follow the usual last-resort approach to problem solving - changing various possible causative factors in the hope that they make the problem more or less likely to occur. We needed another lead.
The solution
But eventually, we noticed something crucial that we had missed until that point: all of the mystery core dumps came from servers containing The Intel Xeon E5-2650 v4. This model belongs to the generation of Intel processors that had the codename “Broadwell”, and it’s the only model of that generation that we use in our edge servers, so we simply call these servers Broadwells. The Broadwells made up about a third of our fleet at that time, and they were in many of our datacenters. This explains why the pattern was not immediately obvious.
This insight immediately threw the focus of our investigation back onto the possibility of processor hardware issues. We downloaded Intel’s Specification Update for this model. In these Specification Update documents Intel discloses all the ways that its processors deviate from their published specifications, whether due to benign discrepancies or bugs in the hardware (Intel entertainingly calls these “errata”).
The Specification Update described 85 issues, most of which are obscure issues of interest mainly to the developers of the BIOS and operating systems. But one caught our eye: “BDF76 An Intel® Hyper-Threading Technology Enabled Processor May Exhibit Internal Parity Errors or Unpredictable System Behavior”. The symptoms described for this issue are very broad (“unpredictable system behavior may occur”), but what we were observing seemed to match the description of this issue better than any other.
Furthermore, the Specification Update stated that BDF76 was fixed in a microcode update. Microcode is firmware that controls the lowest-level operation of the processor, and can be updated by the BIOS (from system vendor) or the OS. Microcode updates can change the behaviour of the processor to some extent (exactly how much is a closely-guarded secret of Intel, although the recent microcode updates to address the Spectre vulnerability give some idea of the impressive degree to which Intel can reconfigure the processor’s behaviour).
The most convenient way for us to apply the microcode update to our Broadwell servers at that time was via a BIOS update from the server vendor. But rolling out a BIOS update to so many servers in so many data centers takes some planning and time to conduct. Due to the low rate of mystery core dumps, we would not know if BDF76 was really the root cause of our problems until a significant fraction of our Broadwell servers had been updated. A couple of weeks of keen anticipation followed while we awaited the outcome.
To our great relief, once the update was completed, the mystery core dumps stopped. This chart shows the number of core dumps we were getting each day for the relevant months of 2017:
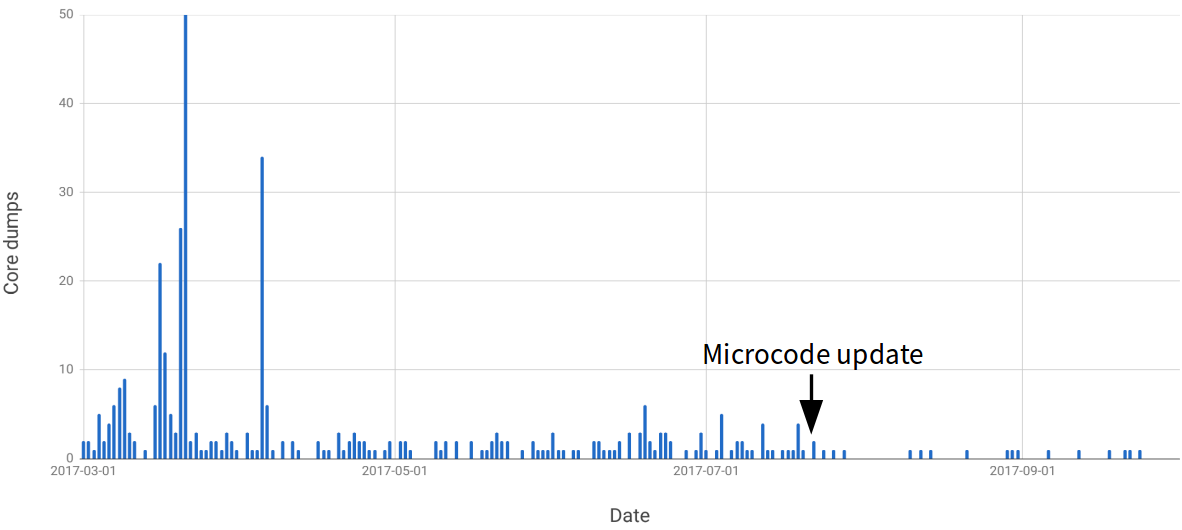
As you can see, after the microcode update there is a marked reduction in the rate of core dumps. But we still get some core dumps. These are not mysteries, but represent conventional issues in our software. We continue to investigate and fix them to ensure they don’t represent security issues in our service.
The conclusion
Eliminating the mystery core dumps has made it easier to focus on any remaining crashes that are due to our code. It removes the temptation to dismiss a core dump because its cause is obscure.
And for some of the core dumps that we see now, understanding the cause can be very challenging. They correspond to very unlikely conditions, and often involve a root cause that is distant from the immediate issue that triggered the core dump. For example, we see segfaults in LuaJIT (which we embed in NGINX via OpenResty) that are not due to problems in LuaJIT, but rather because LuaJIT is particularly susceptible to damage to its data structures by bugs in unrelated C code.
Excited by core dump detective work? Or building systems at a scale where once-in-a-decade problems can get triggered every day? Then join our team.